Monitoring using SNMP
The nevisAppliance features status monitoring using the Simple Network Management Protocol (SNMP). This allows you to monitor all Nevis services remotely by any monitoring tool supporting this protocol.
/etc/snmp/snmpd.conf
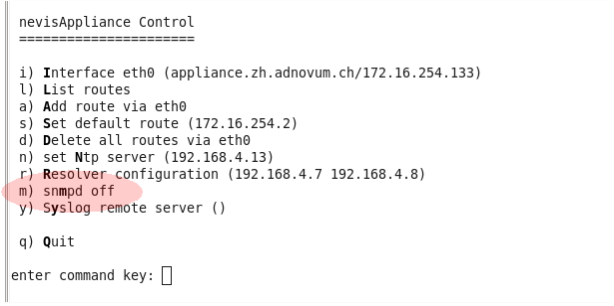
The SNMP daemon can be initialized using the nevisappliance script and the command m.

It creates an snmpd.conf file and sets the community string for read-only access. You can adapt the file according to your requirements. The /usr/share/snmp/mibs/NEVIS-MIB.txt management information base file describes the Nevis-specific parameters that can be supervised via SNMP.
See also Monitoring ClamAV and Database monitoring for information on additional components that you can configure on your nevisAppliance.
The following section shows a small selection of these parameters:
iso.org.dod.internet.private.enterprises.adnovum.nevis.nevismib.proxyTable.proxyEntry.instanceProxyStatus.<instance index>Alternatively, if you are using a failover cluster, the
instanceProxyFOStatusattribute can be checked:iso.org.dod.internet.private.enterprises.adnovum.nevis.nevismib.proxyTable.proxyEntry.instanceProxyFOStatus.<instance index>Indicates whether the nevisProxy instance is running (=1) or not (=0).
iso.org.dod.internet.private.enterprises.adnovum.nevis.nevismib.proxyTable.proxyEntry.instanceProxySessions.<instance index>Number of open user sessions.
You should ensure that you have enough free sessions (at least 80% of the configured maximum).
iso.org.dod.internet.private.enterprises.adnovum.nevis.nevismib.proxyTable.proxyEntry.instanceProxyMemory.<instance index>Virtual memory (in kilobytes) allocated by the working proxy process.
During operation the memory consumption increases and an increase of several gigabytes is not uncommon. Usually, this value does not exceed its initial size by more than 2GB.
iso.org.dod.internet.private.enterprises.adnovum.nevis.nevismib.proxyTable.proxyEntry.instanceProxyResponseTime.<instance index>Average request time (in seconds) of the HTTP requests.
Can be an indication of slow application response times but sometimes you may also measure slow request times due to long-polling ajax requests or the download of huge files. This value is mainly used for statistical purposes and you don't need to configure a threshold.
iso.org.dod.internet.private.enterprises.adnovum.nevis.nevismib.proxyTable.proxyEntry.instanceProxyConnections.<instance index>Number of TCP connections to the nevisProxy instance.
In normal operation, this value shall not exceed 50% of the configured maximum.
iso.org.dod.internet.private.enterprises.adnovum.nevis.nevismib.authTable.authEntry.instanceAuthStatus.<instance index>Indicates if the nevisAuth instance is running (=1) or not (=0).
iso.org.dod.internet.private.enterprises.adnovum.nevis.nevismib.authTable.authEntry.instanceAuthJVMKBHeapUsage.<instance index>Heap usage (in kbytes) of the nevisAuth instance's virtual machine.
The value must not exceed (80%) of the configured limitation (Xmx).
iso.org.dod.internet.private.enterprises.adnovum.nevis.nevismib.logrendTable.logrendEntry.instanceLogrendStatus.<instance index>Indicates if the nevisLogRend instance is running (=1) or not (=0).
iso.org.dod.internet.private.enterprises.adnovum.nevis.nevismib.idmTable.idmEntry.instanceIdmStatus.<instance index>Indicates if the nevisIDM instance is running (=1) or not (=0).
iso.org.dod.internet.private.enterprises.adnovum.nevis.nevismib.idmTable. instanceIdmJVMKBHeapUsage.<instance index>Heap usage (in kbytes) of the nevisIDM instance's virtual machine.
The value must not exceed (80%) of the configured limitation (Xmx).
iso.org.dod.internet.private.enterprises.adnovum.nevis.nevismib.credTable.credEntry.instanceCredStatus.<instance index>Indicates whether the nevisCred instance is running (=1) or not (=0).
iso.org.dod.internet.private.enterprises.adnovum.nevis.nevismib.applianceTable.applianceEntry.instanceApplianceDiskDeviceOnline.1Number of disk devices which are online (to monitor the raid controller).Value must not change (a lower value indicates a device outage).
iso.org.dod.internet.private.enterprises.adnovum.nevis.nevismib.applianceTable.applianceEntry.instanceApplianceFreeMemory.1Available memory (in kilobytes) of the server.
A server should always have enough free memory to handle peak-loads. A minimum of 256Mbytes is recommended.
iso.org.dod.internet.private.enterprises.adnovum.nevis.nevismib.applianceTable.applianceEntry.instanceApplianceFreeSwap.1Free swap space (in kilobytes) of the server.
The server must not use the whole swap space during normal operation. We expect that at least 1GB of swap space will be left unused.
iso.org.dod.internet.private.enterprises.adnovum.nevis.nevismib.applianceTable.applianceEntry.instanceApplianceLoad.1Load of the server.
The load of a server shall not exceed the number of available CPU cores heavily.
iso.org.dod.internet.private.enterprises.adnovum.nevis.nevismib.applianceTable.applianceEntry.instanceApplianceFreeDiskSpace.1Free disk space (in kilobytes) of the server.
Disk space is required to write log or persistent data. Always ensure that there is enough disk space available. A minimum of 10Gbytes is recommended (free disk space can fall below this value during a nevisAppliance update due to the transfer of the new image to the server).
Parameters are accessed on a per instance basis (instance index). You should verify/monitor the instance name as well to make sure that you are monitoring the correct instance.
Extended service statistics
qslog
Additional request statistic information of the monitored nevisProxy instance (OIDs marked as "optional" within the MIB) can be collected via SNMP after activating the statistic log facility. The following CustomLog attribute (or an equivalent definition) has to be configured within the Server node of the navajo.xml of nevisProxy (example for a proxy instance with the name "default").
CustomLog=""|/opt/nevisproxy/bin/qslog -f ISBDUkEa -x -u nvpuser -o
/var/opt/nevisproxy/default/logs/stat.log" "%h %>s %b %D %{clID}e %k
%{Event}e %{dTr1B}e ""
Nagios
The following example shows how you can configure Nagios to monitor your Nevis infrastructure.
check_snmp
The check_snmp plugin needs to be installed on your Nagios server. We recommend adding two commands using this plugin (usually within the /etc/nagios3/commands.cfg file) to verify status responses either by regular expressions or thresholds. Adapt the path "/usr/lib/nagios/plugins/" according to your environment.
Sample commands using check:snmp
define command{
 command_name check_snmp_neviscmd
 command_line /usr/lib/nagios/plugins/check_snmp -H $HOSTADDRESS$ -o $ARG1$ -C
$ARG2$ -t 20 -r $ARG3$
 }
 define command{
 command_name check_snmp_neviscmd_threshold
 command_line /usr/lib/nagios/plugins/check_snmp -H $HOSTADDRESS$ -o $ARG1$ -C
$ARG2$ -t 20 -w $ARG3$
You can now configure the OIDs to monitor within the configuration files of your Nagios server. Figure 3 shows you a sample Nagios configuration to monitor the state of a nevisProxy instance (if it is up or down). The string "public" represents the community string to authenticate the SNMP requests. Adapt it to your environment settings.
Example for checking the status of a nevisProxy instance
define service {
      use                 generic-service
      host_name           myserver
      service_description nevisProxy default status
      check_command       check_snmp_neviscmd!.1.3.6.1.4.1.6059.2.7.20.1.3.1!public!1
 }
nagiosCfg.sh
The shell script /root/tools/nagiosCfg.sh can be used to:
- read the current status information from the specified nevisAppliance over the network, and
- generate a base configuration file that can be used by Nagios.